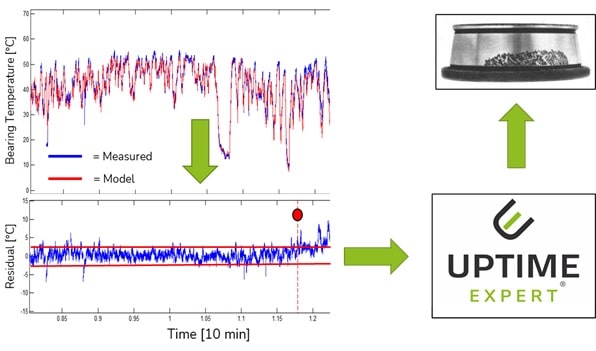
Indicators of degradation are derived from the monitoring data of fleets and equipment. For decision support in practice, this must be achieved with understandable models. The automated root-cause diagnosis should be based on the procedure of the experienced technicians. This creates user acceptance and a common knowledge base for maximum availability.
What is a risk-relevant input to the condition of a fleet or plant?
Preventive maintenance promises to eliminate unforeseen failures and their costs. This requires indicators that indicate a deviation from the expected behavior due to degradation of the plant, and at a sufficiently early stage so that there is still the necessary lead time for preventive measures. Indication is particularly challenging for plants that are operated under transient loads (e.g. drive technology, wind turbines, construction machinery, railways).
Mechatronic systems can degrade through a variety of mechanisms. For preventive maintenance, it must therefore initially be clarified which failure risks can be monitored with which indicators. However, the corresponding instrumentation (for big-data methods) is not expedient, because the sensor technology itself would become a source of unreliability. However, the benefit from the available data is frequently not yet realized. This is consequently the first task.
Does big-data help us?
Determining indicators with machine-learning methods requires massive data sets and high training effort for all possible failure cases. In fact, however, deviations for professionally developed systems occur only rarely and only for a few failure modes. The big-data methods therefore often lack the database. As a black-box process, their results are technically difficult to argue. Their usefulness for precautionary maintenance, protective operation or safety measures is therefore questionable for practical and liability reasons. But there is hope! The determination of root-causes of deviations delivers the alternative method for an accurate recommendation system.
Why should we even concern ourselves with the causes of deviations?
It is relevant to understand that the (operating) time is a very bad measure of the damage of a component (due to wear, aging, fatigue, corrosion, etc.). Instead, the damage progress is modeled and calculated as a function of the load curve and the environmental conditions. Based on the identified cause, the corresponding damage model provides reliable recommendations for preventive activities (preventive operation, shutdown, parts replacement).
Is a model-based expert system economical for diagnosis?
A model-based expert system analyzes failure risks in the same way as maintenance technicians do. The effort for the maintenance of such systems is generally estimated to be very high. It is assumed that the knowledge content cannot be well formalized and, above all, not be transferred from one application to another. However, Uptime’s risk analyses and statistical data on failure events show that degradation mechanisms of components can be formalized and transferred very well because they occur analogously in different industries.
The application of the expert system to a specific plant starts with asset management; i.e. with the creation of the digital twin. It inherits the failure risks and indication and damage models for all its machine elements from the Uptime knowledge base. The models are re-parameterized and, if necessary, supplemented by special aspects of the respective application. Thus, the implementation of this expert system is largely prepared, therefore efficient and fast.
How do we use the knowledge for the automatic indication of deviations?
Uptime Engineering has derived a knowledge base with mor than 600 degradation mechanisms for approx. 100 functional groups from projects for product validation and damage analyses. For supervision and diagnosis these data-sets were extended with indicators. The latter are (on-line) measurable quantities or locally observable evidence. Indicators provide the input for algorithms to detect deviations from the expected behavior of a system or plant. These algorithms are white-box models. Their meaning and reliability in a certain context can be easily assessed. A high capture rate at a low rate of false alarms is developed and adjusted by means of fault seeding. The “healthy” system load response behavior is measured or simulated as a reference.
System monitoring data provide the input for the software Uptime HARVEST to detect indicators of deviations. For integration into a preventive maintenance process (CMB, PDM) these results are reported together with explanations, problem-solving activities and recommendations for precautionary measures. From user feedback, the system learns how to structure the problem-solving process as efficiently as possible.
How does automatic indication and diagnosis work?
Indication and root cause diagnosis are carried out by experienced technicians in the current maintenance practice. Their individual knowledge is explicitly developed and formalized in workshops to become available in the Uptime HARVEST software for automated diagnosis.
For this purpose, the expert system automatically determines the causes that match the observed indicators (backward reasoning method, patent EP 3 84 864 A1). The initial diagnosis is supplemented with information from system control, maintenance, etc. The automation of diagnostics is set up together with the technicians analogous to their problem solving approach. Accordingly, their acceptance is very high.
Discarded diagnoses indicate knowledge deficiencies because the actual cause of deviations is not or not correctly mapped in the expert system. Such cases are knowledge generators. They trigger the process of investigating previously unknown damage mechanisms and thus lead to the problem-driven expansion of risk coverage. This prevents exotic series failures, which might occur after long running times or under exotic load conditions.


You are currently viewing a placeholder content from Facebook. To access the actual content, click the button below. Please note that doing so will share data with third-party providers.
More Information