The standard methods of technical reliability are not usefully applicable to all tasks in practice. Uptime ENGINEERING has therefore developed a comprehensive set of special methods for the reliability process over the last few years. This was often done to solve specific tasks in the context of customer projects. Novel tasks in current projects also lead to a permanent expansion of the method library.
The focus is on methods of applied statistics and physics of failure. In general, a design is pursued that supports the consistent reliability process in the product life cycle in the best possible way. The methods are therefore implemented in Uptime SOLUTIONS in a generic, parameterized form. As a result, they are quickly available for all applications of the software without any programming work.
Physics of Failure (PoF) is a science-based modelling approach to evaluate the damaging effects as a function of the operating conditions. It is applied to all integration levels from components to complete technical systems.
A comprehensive set of models for a variety of failure mechanisms can be found in scientific literature (Arrhenius, Woehler, Manson-Coffin, Norton, etc.). The Uptime PoF model library extends this set to cover an even wider range of specific failure modes. Moreover, the software Uptime SOLUTIONS PoF is also used for the development of dedicated models for specific failure modes
PoF is used during the product life cycle. During design PoF is the classical approach for the systematic investigation of robustness against various failure risks. Product validation refers to PoF models for quantitative test assessment. This is used for the optimisation of test procedures with respect to various types of failure risks (Damage Calculation). Risk focused fleet monitoring relies on PoF for the evaluation of the actual load severity and for the calculation of failure probability, i.e. the remaining useful life.
The Uptime ENGINEERING PoF model library evaluates the kinetics of damaging mechanisms in a generic form. It delivers templates for application to various particular cases in multiple products and industries. PoF model application requires parametrization with load carrying capacities of the considered comonents. No cumbersome data labelling or time-consuming model training is necessary. PoF models are transparent, model assumptions and limitations are easy to assess by engineers. This is particularly relevant in the context of decision making.
Bedeutung.
Damage calculation derives damage accumulation from load histories. This is executed via Physics of Failure models applied to time series of load data. Load can be of a mechanical, thermal, chemical and electrical nature. Thus, a corresponding set of input data is necessary to cover all types of damaging effects in a product. If the measurement of these data at critical locations is not possible, local load is generated from global load data via transfer functions (“virtual sensors”).
Damage calculation is used to evaluate the damaging effects of a duty cycle. Various damage mechanisms are covered by a corresponding set of models. During planning phases, input time series are simulated and measured data are used as soon as prototypes are available. This is particularly useful for test optimisation relative to reference duty cycles. It is also used for test acceleration with respect to certain failure modes.
Damage calculation delivers a quantitative comparison of damage kinetics for various load histories. The models are adapted to the available input data. Simplified models are used very early for planning purposes. Higher accuracy is achieved via System Response Modelling or measurement, performed during Design Verification.
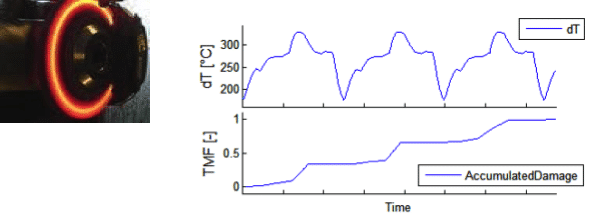
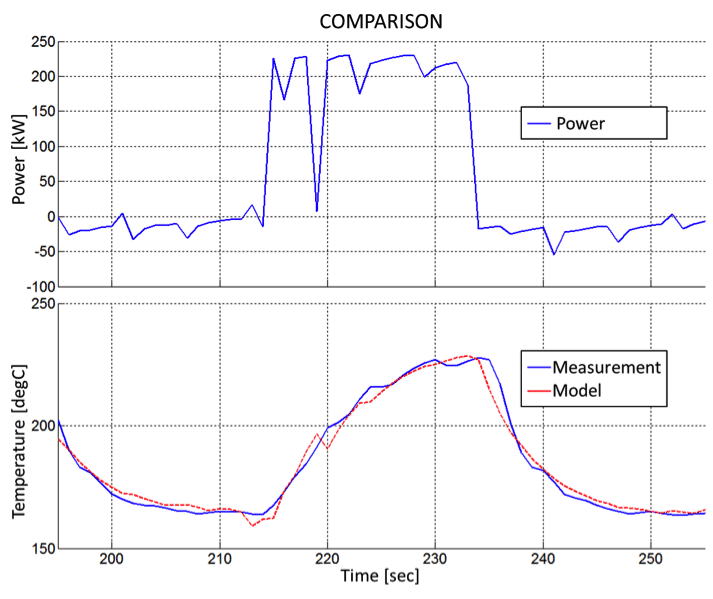
Most of the actual reliability problems are related to transient local stresses, evolving from gradients in load, load-transfer, or load capacity. A well-known example is thermal fatigue, which results from locally delayed heating and cooling due to gradients in thermal mass or heat transfer. Damage evaluation for dynamic duty cycles requires the accurate determination of these transient kinetics. Since such measurements are difficult and costly, system response modelling is used as a replacement for permanent measurement.
A one-time measurement of the system response to load cycling is used to parametrise a transfer function. It maps the observable load data to the local load under transient conditions. This mapping is furthermore used as a “virtual sensor” for all types of duty cycles.
Virtual sensors are used for the evaluation of local load under various duty cycles. During product development, virtual sensors are used for test assessment. During fleet monitoring, they generate the expectation or reference value for State Detection via residual analyses.
After the initial measurement of the system response, no extra instrumentation is required for load assessment of any further test or duty cycle. System response modelling delivers high accuracy for dynamic system behaviour at low effort when compared to the CAE approach. No high frequency data sampling needs to be executed, whereas load information for various locations within a product is derived from global load data
Statistics deliver a powerful set of methods to uncover correlations and describe dependencies in data sets. Applied statistics in reliability engineering include reliability demonstration and lifetime, regression and variance, as well as data clustering and graphical representation techniques.
Applied statistics deliver a quantitative assessement of the state of the reliability. It distinguishes quality problems from reliability issues and helps to identify their root-causes. Statistics evaluates the potential of a test program for reliability demonstration in planning and during execution. Statistics model system behavior and quantifies scatter bands, providing the basis for detection of significant deviations. Statistical lifetime modelling is used in the framework of predictive maintenance.
Applied statistics deliver a quantitative assessement of the state of the reliability. It distinguishes quality problems from reliability issues and helps to identify their root-causes. Statistics evaluates the potential of a test program for reliability demonstration in planning and during execution.
Statistics model system behavior and quantifies scatter bands, providing the basis for detection of significant deviations. Statistical lifetime modelling is used in the framework of predictive maintenance.
State detection algorithms discriminate between healthy and degraded system conditions. The healthy reference condition is generated by System Response Modelling. Such references have to reflect the details of the transient system behaviour to allow for high quality state detection, i.e. a high capture rate at a low frequency of false alarms.
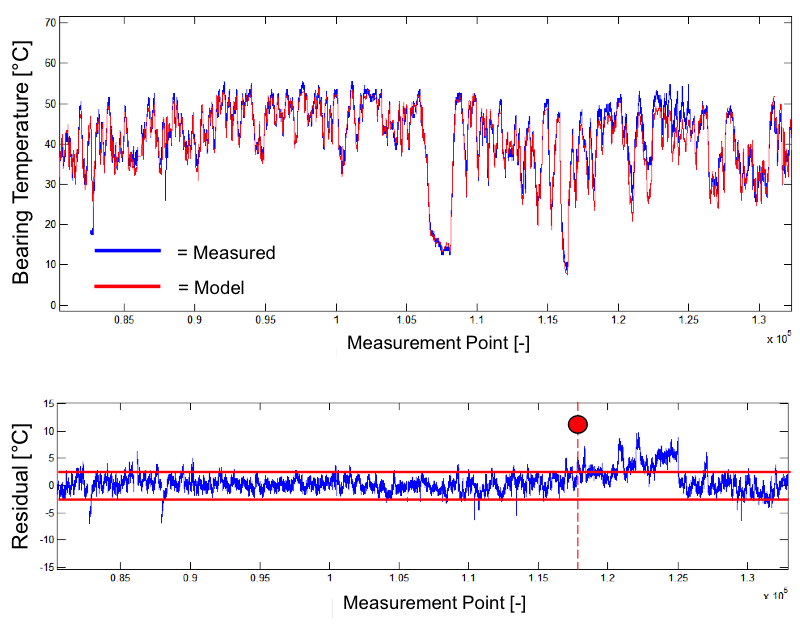
Highly sensitive system observation via residual analysis delivers state detection with low and quantified error probability. States are stored as a time series along with measured data to make them available for post-processing in combination with other types of information and fleet supervision data (information merging).
A compact set of supervision algorithms covers all relevant failure risks. Full usage of the available SCADA data as input. Very low amount of extra instrumentation. Transparent, understandable algorithms. Extreme high probability of detection for deviating system properties under realistic load conditions.
Unlike FMEA, which concentrates on the consequences of a fault, the focus of Failure Potential Analysis (FPA) is on the root-causes and damaging conditions of failures that evolve over operation time. FPA-workshops investigate how a technical system or component might fail during operation due to degradation. These workshops make the implicit knowledge of domain experts explicit.
The FPA identifies the damage driving conditions for each failure mechanism, along with their observables, indicators and critical properties. Furthermore testing, simulation and quality activities for mitigation of each of these risks are identified. These parameters make the FPA the platform for the definition of Design Validation programs and for risk-focused fleet supervision.
The general purpose of is FPA Reliabilty risk reduction. This can be realised in several ways:
FPA delivers a transparent and well-structured knowledge base of reliability risks. A corporate reference on generic reliability risks evolves. It is improved and extended with each FPA workshop. FPA results are used throughout the product life cycle: for test assessment and optimisation of validation programs, for quality specification in terms of reliabilty, and for risk-focused fleet analysis.
FPA is the cornerstone for the Reliability Process.
Diagnosis determines the root cause of a deviating system behaviour, i.e. it explains a non-healthy State Detection as consequence of a damage mechanism. In general, this is a difficult task since a deviation (e.g. performance reduction) is typically not specific for a certain root-cause. Thus, the detection of a deviation indicator typically refers to several potential damage mechanisms. The final diagnosis requires additional information for discrimination between the root-cause candidates. This includes additional measurement channels, on-site inspection, system response upon critical operation modes, or time evolution of the observed indicators.
Uptime EXPERT executes diagnosis automatically using the knowledge base of failure mechansims to model the “inference process”. The diagnostic algorithms correlate observations to root causes – as an experienced service technician would, and as determined in the Failure Potential Analysis.
Root-cause diagnosis is used for problem solving. It delivers proposals how to proceed in order to identify the root-causes for faults. It is applied to fleet supervision for recommendation of condition-based maintenance tasks (CBM). Moreover, the diagnosis of a failure mechanism selects the proper damage model for evaluation of remaining lifetime. Unlike big-data analytics, Uptime EXPERT delivers the explanations and the arguments for results. This is provided in engineering language to generate transparency on the underlying technical issue.
In the framework of fleet supervision Uptime EXPERT automatically determines the root-causes for deviating system behavior. It delivers the health-state of the observed system. The insights gained through diagnosis deliver the basis for risk management and apt mitigation measures. Diagnosis is used for maintenance optimization in terms of condition-based and predictive maintenance (CBM and PDM).
Prognosis predicts the system behaviour, in particular the failure probability for time-to-failure assessment. To this end, Uptime ENGINEERING lifetime models evaluate damage propagation as a function of damaging conditions. They depend on the damage mechanism (e.g. high temperature for thermal aging vs. load cycling for fatigue). Therefore, prognostic models have to be carefully selected in order to model the actual damage process. This is provided by the Diagnosis of root-causes, executed prior to prediction.
Proper effort allocation in CBM requires the prognosis of the remaining useful life for a faulty component. Uptime ENGINEERING lifetime models are transferred from the risk analyses during product validation projects. This enables the focus to be placed on the actual system risk.
Prognosis is crucial for decision making in the context of risk-based maintenance (CBM, PDM). It improves the maintenance quality at reduced costs. On a management level, prognosis supports supervision, risk management and O&M budgeting.
You are currently viewing a placeholder content from Facebook. To access the actual content, click the button below. Please note that doing so will share data with third-party providers.
More Information