The standard methods of technical reliability are not usefully applicable to all tasks in practice. Uptime ENGINEERING has therefore developed a comprehensive set of special methods for the reliability process over the last few years. This was often done to solve specific tasks in the context of customer projects. Novel tasks in current projects also lead to a permanent expansion of the method library.
The focus is on methods of applied statistics and physics of failure. In general, a design is pursued that supports the consistent reliability process in the product life cycle in the best possible way. The methods are therefore implemented in Uptime SOLUTIONS in a generic, parameterized form. As a result, they are quickly available for all applications of the software without any programming work.
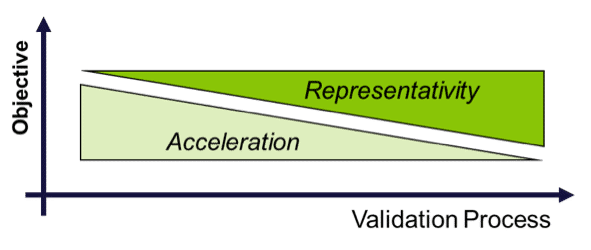
Testing simulates the intended product usage in order to reveal design weaknesses. As both time-to-market and the related costs are critical, tests have to be efficient, i.e. they have to deliver a maximum of information within the given schedule. Two types of tests are intelligently combined in order to achieve this goal:
Accelerated testing (HALT, HASS) is done for well understood failure mechanisms. Prototype components allow for test execution at a very early stage of product development.
Representative testing aims to cover all possible failure modes – including unknown phenomena. The system under development should be subjected to various realistic operation modes and boundary conditions.
Fig: Transition from test acceleration to representation along the validation process
Tests are designed wirh respect to customer usage patterns of the product as identified in the Usage Space Analysis. In general, component testing is directed to suppliers with supervision and guidance from the OEM. Test acceleration is achieved via the intensity and the frequency of load. The test contributions to validation against various failure mechanisms are evaluated via Damage Calculation in order to avoid over- or under-testing.
A well-balanced sequence of accelerated and representative tests provides the highest efficiency of a Validation programme. Accelerated tests demonstrate component maturity at early stages of product development. This allows for front-loading of problem solving.
It keeps the development process on track at reduced costs. It minimizes the failure rate of subsequent representative tests. Overall, a well-designed sequence of tests leads to the maximum actual reliability demonstration.
Physics of Failure (PoF) is a science-based modelling approach to evaluate the damaging effects as a function of the operating conditions. It is applied to all integration levels from components to complete technical systems.
A comprehensive set of models for a variety of failure mechanisms can be found in scientific literature (Arrhenius, Woehler, Manson-Coffin, Norton, etc.). The Uptime PoF model library extends this set to cover an even wider range of specific failure modes. Moreover, the software Uptime SOLUTIONS PoF is also used for the development of dedicated models for specific failure modes
PoF is used during the product life cycle. During design PoF is the classical approach for the systematic investigation of robustness against various failure risks. Product validation refers to PoF models for quantitative test assessment. This is used for the optimisation of test procedures with respect to various types of failure risks (Damage Calculation). Risk focused fleet monitoring relies on PoF for the evaluation of the actual load severity and for the calculation of failure probability, i.e. the remaining useful life.
The Uptime ENGINEERING PoF model library evaluates the kinetics of damaging mechanisms in a generic form. It delivers templates for application to various particular cases in multiple products and industries. PoF model application requires parametrization with load carrying capacities of the considered comonents. No cumbersome data labelling or time-consuming model training is necessary. PoF models are transparent, model assumptions and limitations are easy to assess by engineers. This is particularly relevant in the context of decision making.
Bedeutung.
The Uptime ENGINEERING system risk assessment performs top-down identification of various types of risks, related to technology, time, organisation, quality and maintenance. It considers the system design, the manufacturing processes, the usage conditions, applications, lifetime expectations, etc. Complementary to the system risk assessement, bottom-up analysis is used for a detailed assessment of functional and reliability risks.
The system risks deliver the tasks for the Reliability Plan, which organizes the contributions from various OEM teams and suppliers. It eliminates non-technical risks in order to improve the efficiency of verification and validation testing.
A comprehensive risk analysis delivers the basis for a systematic product development, outlined in the Verification and Validation programme. The risk analysis also identifies tradeoffs between targets at an early stage of product development. Thus, it contributes to the front-loading of problem solving prior to costly prototyping.
Statistics deliver a powerful set of methods to uncover correlations and describe dependencies in data sets. Applied statistics in reliability engineering include reliability demonstration and lifetime, regression and variance, as well as data clustering and graphical representation techniques.
Applied statistics deliver a quantitative assessement of the state of the reliability. It distinguishes quality problems from reliability issues and helps to identify their root-causes. Statistics evaluates the potential of a test program for reliability demonstration in planning and during execution. Statistics model system behavior and quantifies scatter bands, providing the basis for detection of significant deviations. Statistical lifetime modelling is used in the framework of predictive maintenance.
Applied statistics deliver a quantitative assessement of the state of the reliability. It distinguishes quality problems from reliability issues and helps to identify their root-causes. Statistics evaluates the potential of a test program for reliability demonstration in planning and during execution.
Statistics model system behavior and quantifies scatter bands, providing the basis for detection of significant deviations. Statistical lifetime modelling is used in the framework of predictive maintenance.
Damage calculation derives damage accumulation from load histories. This is executed via Physics of Failure models applied to time series of load data. Load can be of a mechanical, thermal, chemical and electrical nature. Thus, a corresponding set of input data is necessary to cover all types of damaging effects in a product. If the measurement of these data at critical locations is not possible, local load is generated from global load data via transfer functions (“virtual sensors”).
Damage calculation is used to evaluate the damaging effects of a duty cycle. Various damage mechanisms are covered by a corresponding set of models. During planning phases, input time series are simulated and measured data are used as soon as prototypes are available. This is particularly useful for test optimisation relative to reference duty cycles. It is also used for test acceleration with respect to certain failure modes.
Damage calculation delivers a quantitative comparison of damage kinetics for various load histories. The models are adapted to the available input data. Simplified models are used very early for planning purposes. Higher accuracy is achieved via System Response Modelling or measurement, performed during Design Verification.
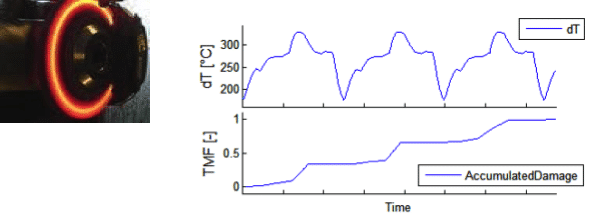
Most of the actual reliability problems are related to transient local stresses, evolving from gradients in load, load-transfer, or load capacity. A well-known example is thermal fatigue, which results from locally delayed heating and cooling due to gradients in thermal mass or heat transfer. Damage evaluation for dynamic duty cycles requires the accurate determination of these transient kinetics. Since such measurements are difficult and costly, system response modelling is used as a replacement for permanent measurement.
A one-time measurement of the system response to load cycling is used to parametrise a transfer function. It maps the observable load data to the local load under transient conditions. This mapping is furthermore used as a “virtual sensor” for all types of duty cycles.
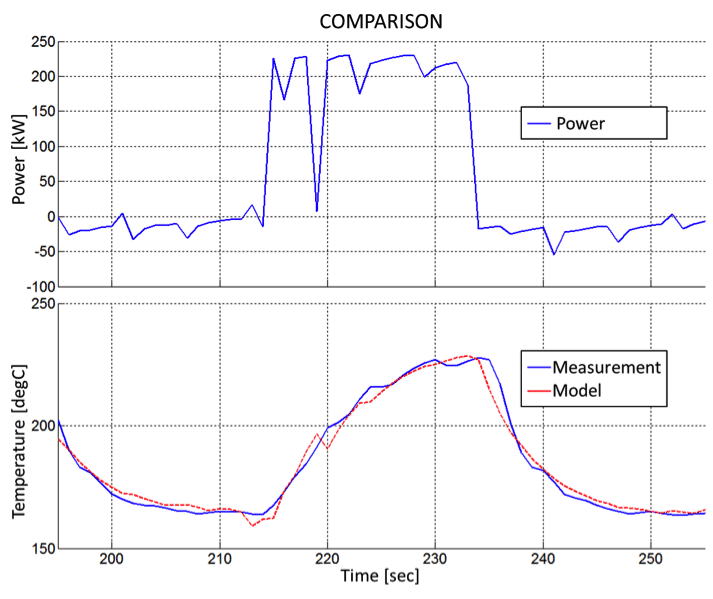
Virtual sensors are used for the evaluation of local load under various duty cycles. During product development, virtual sensors are used for test assessment. During fleet monitoring, they generate the expectation or reference value for State Detection via residual analyses.
After the initial measurement of the system response, no extra instrumentation is required for load assessment of any further test or duty cycle. System response modelling delivers high accuracy for dynamic system behaviour at low effort when compared to the CAE approach. No high frequency data sampling needs to be executed, whereas load information for various locations within a product is derived from global load data
Accelerated testing starts as soon as possible in the product development process to demonstrate component maturity. However, system reliability demonstration requires complementary system tests. Reliability Growth monitors the reliability performance of such tests under conditions similar to the future product operation. Continuous supervision of durability test fleets measures the slope of reliability in terms of MTBF (or MDBF or MTTR).
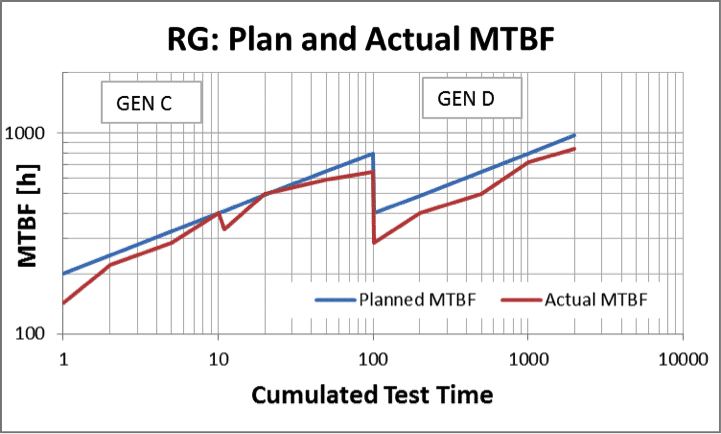
MTBF represents the customer’s expectation. It quantifies to what extent the product does what it is intended to do. Moreover, MTBF measures the quality of the validation process. Thus, it is also used to predict reliability target achievement.
MTBF, a simple yet significant KPI, is derived from the large volume of distributed and heterogeneous validation activities. It monitors customer expectations and provides an objective assessment of the validation process. Early indication of mass production problems allows fast reaction before costs and impact on customer confidence become severe.
Product development is then effective when taking into account future product use cases, in a variety of different applications, considering different customer use behaviour.
Usage space analysis evaluates how different these conditions actually are. This assessment uses field data, which cover the variety of usage conditions. Principal component analysis (PCA) projects the set of measured variables into a – generally much smaller – set of independent variables.
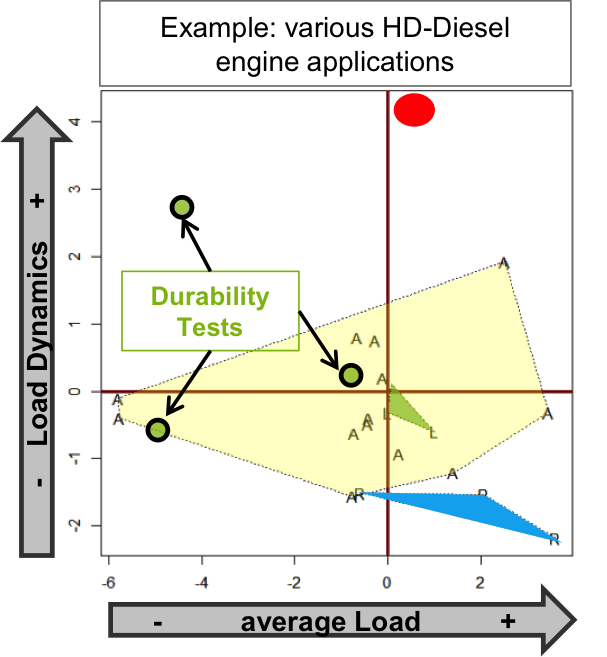
A Usage Space Analysis delivers the assessment of product usage from a load point of view. In addition, it determines the severity of durability tests relative to customer usage. Furthermore, it indicates outlier-applications, which require specific testing, without synergy for other applications.
The usage space links testing to the diversity of future load conditions. It evaluates the nature of durability tests in view of customer duty cycles. In many practical cases the PCA reveals the actual usage of a product to be less heterogeneous than expected. This helps keep the test variety low without spoiling the quality of a test programme. Usage space analysis assesses the cost/benefit relationship of outlier-applications. It also delivers test requirements from changes in load profiles, applications, power ratings, etc.
Reliability targets are set for the complete system according to market conditions. They are decomposed to deliver a consistent set of component targets. The standard method for this job – based on the reliability block diagram – delivers meaningful results only for simple assemblies. For this reason, Uptime ENGINEERING takes experience based on the results of the Risk Assessment into account when determining targets. Targets for functional groups are modified according to their complexity and risk level.
Reliability Targeting is used for the risk-related allocation of validation effort among function groups. Targets for low-risk components are tightened to generate potential for target reduction of high-risk components. This is necessary because the reliability targets may not be completely demonstrable with the resources available
Testing volume is concentrated on risk focus items. The reliability targets are demonstrated primarily for these risk focus groups.
Unlike FMEA, which concentrates on the consequences of a fault, the focus of Failure Potential Analysis (FPA) is on the root-causes and damaging conditions of failures that evolve over operation time. FPA-workshops investigate how a technical system or component might fail during operation due to degradation. These workshops make the implicit knowledge of domain experts explicit.
The FPA identifies the damage driving conditions for each failure mechanism, along with their observables, indicators and critical properties. Furthermore testing, simulation and quality activities for mitigation of each of these risks are identified. These parameters make the FPA the platform for the definition of Design Validation programs and for risk-focused fleet supervision.
The general purpose of is FPA Reliabilty risk reduction. This can be realised in several ways:
FPA delivers a transparent and well-structured knowledge base of reliability risks. A corporate reference on generic reliability risks evolves. It is improved and extended with each FPA workshop. FPA results are used throughout the product life cycle: for test assessment and optimisation of validation programs, for quality specification in terms of reliabilty, and for risk-focused fleet analysis.
FPA is the cornerstone for the Reliability Process.
Validation confirms that a product has been reasonably developed. Practically, it is executed via demonstration of the reliability and lifetime targets. This can be a very time consuming and costly process, which requires various inputs. Risk Assessment generates the criteria for task assessment. The Usage Space identifies technical targets as representative duty cycles. Damage Models deliver risk-related test assessment
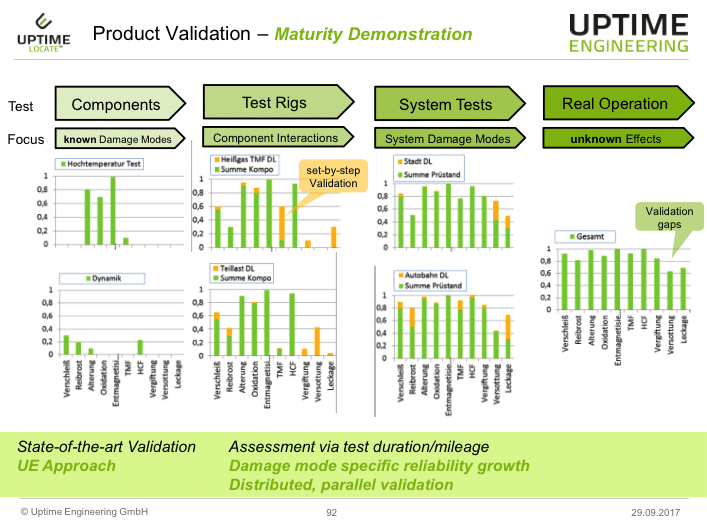
For programme optimisation, certain failure modes are addressed as early as possible with component or rig tests for demonstration of component maturity. Subsequently the interaction of components is validated. Finally, the complete mechatronic system is tested in a representative mode to uncover unknown risks.
The assessment of test contributions allows for optimised of effort allocation. It avoids over- or under-testing. It organizes the worksplit along the supply chain, with defined responsibilities. Reliability demonstration is assessed for various product variants with diverse usage conditions. After programme planning, the actual target demonstration is monitored for recommendation whenever failures occur or changes put the target achievement at risk.
Products are validated with respect to a variety of failure modes in view of future customer operation. Heterogeneous usage modes are addressed by one common programme. Common parts synergies are used for cost reduction without quality reduction. Suppliers deliver maturity demonstration for their components. The OEM integrate contributions and concentrates on system issues.
You are currently viewing a placeholder content from Facebook. To access the actual content, click the button below. Please note that doing so will share data with third-party providers.
More Information